Thread
1|N: Barry @ritholtz did a nice piece in Bloomberg Opinion on, among other things, the importance of “avoiding the dogs” as a key to stock-picking success over the long run. https://www.bloomberg.com/opinion/articles/2019-07-29/winner-take-all-phenomenon-rules-the-stock-market-too
1|N: Barry @ritholtz did a nice piece in Bloomberg Opinion on, among other things, the importance of “avoiding the dogs” as a key to stock-picking success over the long run. https://www.bloomberg.com/opinion/articles/2019-07-29/winner-take-all-phenomenon-rules-the-stock-market-too
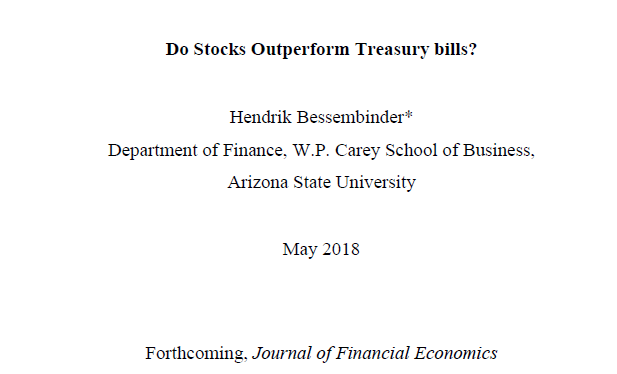
3|N: Anyway, Barry’s article refers to a forthcoming paper in the JFE by Hendrik (Hank) Bessembinder, “Do Stocks Outperform Treasury Bills.”
https://papers.ssrn.com/sol3/papers.cfm?abstract_id=2900447
https://papers.ssrn.com/sol3/papers.cfm?abstract_id=2900447
4|N: In it there is a lot of interesting stuff about skew and the equity premium puzzle, namely the claim that slightly more than half of names in the CRSP database failed to earn the return of the one-month US Treasury over the same time horizon.
5|N: And that the median time a stock is in the CRSP database (which covers a 90 year period starting in 1926) is just 7 ½ years. (Another strike against the buy-and-hold strategy in every, or even most, situations).
6|N: But the report then refocuses on skew, and goes to suggest that the biggest winners represent the vast majority of excess returns in the stock market.
“Simply put, large positive returns to a few stocks offset the modest or negative returns to more typical stocks.”
“Simply put, large positive returns to a few stocks offset the modest or negative returns to more typical stocks.”
8|N: “The best performing 4% of listed companies explain the net gain for the entire US stock market since 1926,” he states above.
9|N: But to be clear what he specifically means is that the EXCESS returns of the stock market over treasuries are the responsibility of just 4% of listed companies’ securities.
10|N: I think this is all a bit misleading.
11|N: Firstly, once inside the paper you discover that these 4% aren’t the top 4% of the Dow 30 or even the S&P 500, but 4% of the 25,300 companies that have appeared in the CRSP database over the past 90 years.
12|N: That’s 1,092 companies. More than twice as many as there are in the S&P 500.
13|N: And back to point 6 above, he is effectively stating – as if it is an epiphany – that the biggest winners are responsible for the majority of excess returns.
14|N: This must be a tautology below some level of concentration. Because – naturally – of course the portfolio names with the highest excess returns drive the excess returns of the portfolio.
15|N: But my biggest issue is the statement that the top 1,092 top performing companies account for all the net wealth creation.
16|N: At first blush the reader might assume that the other 24,208 equity securities underperformed. This is not true. In fact, another 9,579 stocks outperformed US Treasurys.
17|N: And back on the point made in 4 above, with the claim that less than half the names outperformed the return of the one-month US Treasury over the same time horizon.
Well, less than half the names underperformed as well.
Well, less than half the names underperformed as well.
18|N: Indeed nearly 4.8% of the names in the universe earned returns that were in-line with Treasurys.
So less than half the universe outperformed, and less than half the universe underperformed.
So less than half the universe outperformed, and less than half the universe underperformed.
19|N: Yet if this point had been highlighted (and not merely footnoted) it wouldn’t have grabbed as much attention, nor suited the intended narrative.
20|N: Yet the author didn’t highlight that point, but instead led with the story that less than half the names beat Treasurys, and that 4% of the names represented 100% of the excess returns.
21|N: With soundbites masquerading as datapoints, he concludes that "results presented here reaffirm the importance of portfolio diversification.”
22|N And that “poorly diversified portfolios will underperform because they omit the relatively few stocks that generate large positive returns.”
23|N: This data just doesn’t support this argument.
24|N: And the conclusion is illogical.
And back to Barry’s implicit point, I don’t know why ensuring that you own the losers is necessarily the best way forward.
And back to Barry’s implicit point, I don’t know why ensuring that you own the losers is necessarily the best way forward.

 Read on Twitter


