I was working with @Clint3200 and looking at the data and criteria for the County alert map.
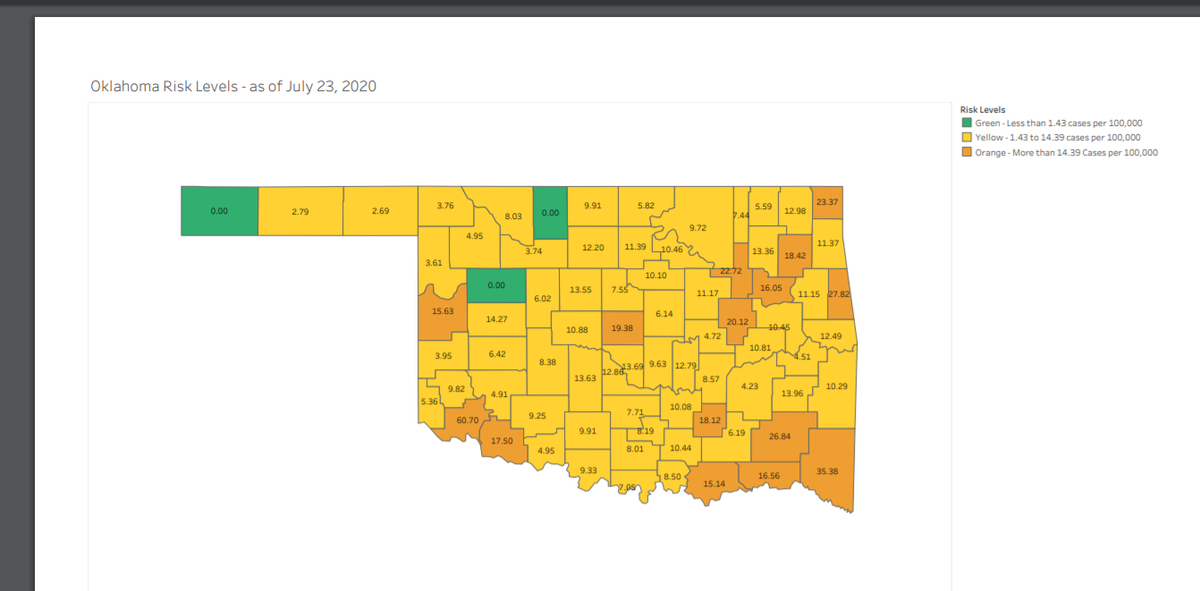
This is the latest map:
https://coronavirus.health.ok.gov/sites/g/files/gmc786/f/county_risk_levels_trends_20200723.pdf
This is the latest map:
https://coronavirus.health.ok.gov/sites/g/files/gmc786/f/county_risk_levels_trends_20200723.pdf
Here's Oklahoma County's data today (i realize the data for the risk map was the 23rd, but the let's just look at today's numbers since they are available).
Case: 8,274
Deaths: 92
Recoveries: 6,431
Active cases 1,751
Case: 8,274
Deaths: 92
Recoveries: 6,431
Active cases 1,751
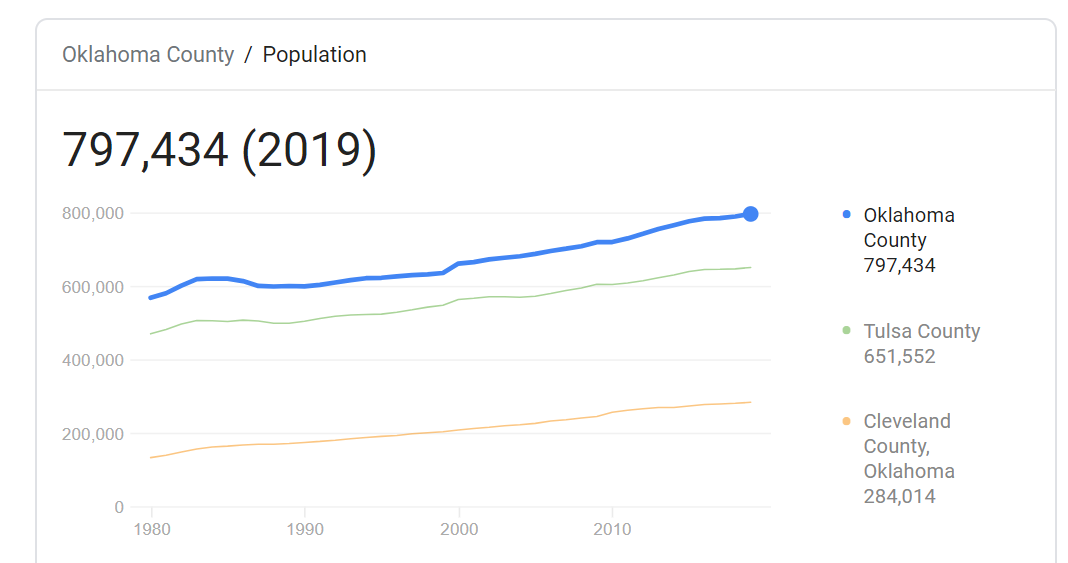
Oklahoma county population is 797,434 (2019).
So, 1,175 / 797,434 = 0.002195793006067
That means, for every one person in OK County, .002195793 has COVID
So, 1,175 / 797,434 = 0.002195793006067
That means, for every one person in OK County, .002195793 has COVID
So, to find out what the cases per 100,000 is, you must multiple .002195793 by 100,000.
When you do that, you get 219.579; So 220 cases per 100,000!!! NOT 19.38!!!
When you do that, you get 219.579; So 220 cases per 100,000!!! NOT 19.38!!!
It is off by a factor of 10! the map should be cases per 10,000 NOT 100,000!
@KOCODillon @KassieMcClung Any ideas why this is so off, am I missing something?
@KOCODillon @KassieMcClung Any ideas why this is so off, am I missing something?
If they are measuring 19.38 cases of increase per day, that’s closer but still off (plus the delays in data make that number superfluous anyways).

 Read on Twitter

