The #COVID19 epidemic is rapidly growing throughout the US. What happens now? Here I try to make some predictions, but mostly try to explain how I think about the epidemic. 1/14 https://twitter.com/COVID19Tracking/status/1327400656328507392
The US just reported ~170,000 cases in a day. However, there hasn't been a sudden increase in transmission. This is the same exponential growth process going on for weeks now. Rt has ticked up from a US average of ~1 in August to ~1.15. Data from https://rt.live/ . 2/14
This increase in Rt can be ascribed to seasonality of the virus. Seasonality of respiratory pathogens is (incredibly) not well understood but is thought to be due to a combination of indoor crowding and increased stability of viral particles in drier winter air. 3/14
In the 2009 swine influenza pandemic we saw a spring wave, ongoing summer circulation and then a substantial and rapid fall wave when seasonality took effect in September. From https://www.cdc.gov/flu/weekly/weeklyarchives2009-2010/09-10summary.htm. 4/14
Similarly, the 1918 influenza pandemic showed summer circulation but had a rapid and substantial fall wave that resulted in most of the mortality of the pandemic. 5/14
In general, Rt depends on seasonality, societal behavior and population immunity. States that opened early had summer surges that resulted in perhaps 15% to 20% of the population infected before immunity and behavior brought surges under control. 6/14 https://twitter.com/trvrb/status/1291860659118804992
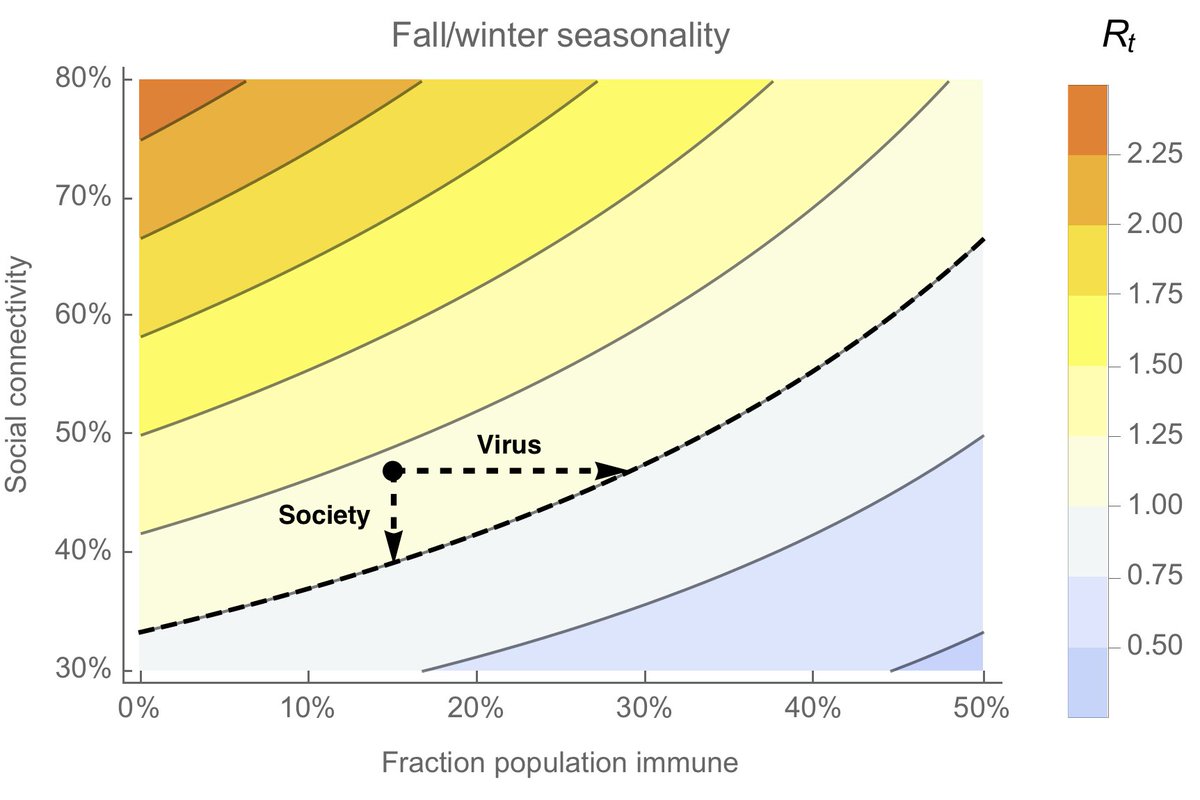
Here I'm demonstrating this relationship in a contour plot that shows how social connectivity and population immunity influence Rt. In August, the US as a whole was roughly on the dashed line of Rt = 1. 7/14
Over the course of Sep and Oct, seasonality crept in and increased Rt by perhaps 20%. 8/14
This increase in Rt due to seasonality tilted the dynamic equilibrium towards transmission. Here, I'm showing the same plot of social connectivity and population immunity but with a 20% increase in R0 due to seasonality. 9/14
You can see that where we had been at Rt ~1 (shown as the black dot) now corresponds to Rt ~1.15 and results in an exponentially growing epidemic. 10/14
We now have a choice in terms of how we get back to Rt<1. The virus "wants" to take us to the right towards more infections, where population immunity brings transmission back down. Alternatively, we can scale back social connectivity to curb transmission. 11/14
A US-wide epidemic with Rt = 1.15 will result in an additional 25% of the population infected before the epidemic is resolved, while an epidemic with Rt = 1.2 will result in an additional ~30% of the population infected. 12/14
We're approaching these numbers in Wisconsin (310k total cases for ~1.2M infections in a population of 5.8M for ~21% of the state infected) and North Dakota (60k total cases for ~240k infections in a population of 760k for ~32% of the state infected). 13/14
If we don't take action soon the virus will decide for us. An eventual 30% of the US infected would correspond to ~450k deaths (at an IFR of 0.45%) and many more cases of #longcovid. 14/14

 Read on Twitter


