(1/n) We often see related datasets (multiple vaccine trials, multiple trials exploring the amyloid hypothesis in Alzheimer’s, basket trials in oncology) How do we think about multiple groups of data at once? A tweetorial on motivating shrinkage estimates….
(2/n) A lot of good examples are basket trials in oncology.
Example ROAR by @VivekSubbiah
https://www.thelancet.com/journals/lanonc/article/PIIS1470-2045(20)30321-1/fulltext
We are exploring a targeted therapy in multiple tumor types. Often these trials are single arm trying to show superiority to a pre-specified response rate.
Example ROAR by @VivekSubbiah
https://www.thelancet.com/journals/lanonc/article/PIIS1470-2045(20)30321-1/fulltext
We are exploring a targeted therapy in multiple tumor types. Often these trials are single arm trying to show superiority to a pre-specified response rate.
(3/n) Often these are rare cancers, so we might see 20 patients per tumor type. How do such data behave? Suppose we observe 4 baskets with 11/20 responses in tumor type A, and then 12/20, 13/20, and 14/20 in groups B,C,D. What should our point estimates be?
(4/n) We know for a single group that observed proportions are unbiased. If my ONLY data was 14/20 in group D, then 70% is a reasonable unbiased point estimate. Does our knowledge of the data for groups A,B,C matter? Is the whole more than the sum of the parts?
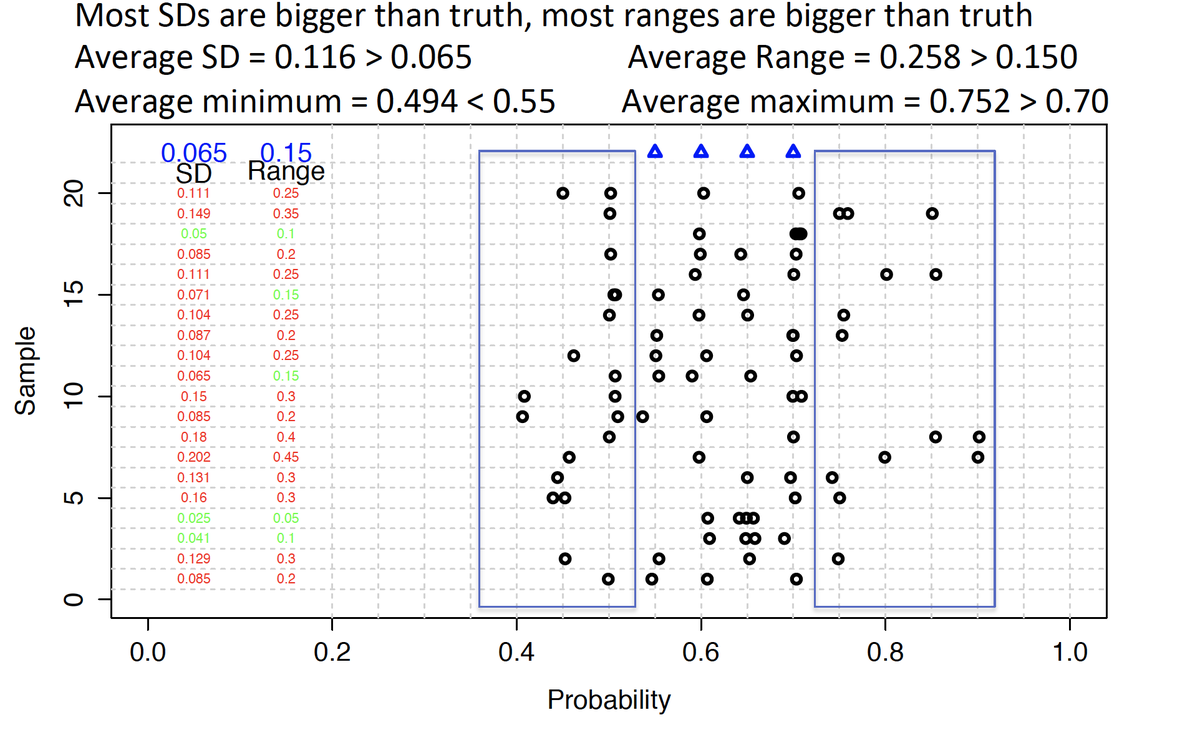
(5/n) Suppose the underlying true (not data, the truth) response rates were 55%, 60%, 65%, and 70% in groups A,B,C,D. What would the data look like? The blue triangles below are the underlying truth, each row of black dots is a randomly generated set of observed proportions.
(6/n) In a real trial, we only see our one set of data. Here, I generated 1,000,000 such datasets to see patterns, and plotted the first 20 in the rows of the figure. While individual group proportions may be unbiased, the totality of the evidence shows interesting biases.
(7/n) Take the range of the observed proportions, for example. The four underlying truths span a 15% range (55-70%). The range of the observed proportions tends to exceed 15% (the average observed range is almost 26%). The data tends to be more spread out than the truth.
(8/n) For the statistics oriented, variability is one way. If the truths for each group have some variability, the observed proportions are those truths plus random noise. The variability of “truth plus random noise” is greater than the variability of “truth alone”.
(9/n) The extremes are biased. The actual maximal truth is 70%. The average maximal observed proportion is 75.2%. Of the 1,000,000 simulated dataset. The mirror image occurs for the minimum (truth 55%, average observed minimum 49.4%)
(10/n) When we see observed data in groups, we know not only the individual group data, but the context. We know where each group ranks in relation to the others. We know which observed proportions are the highest and lowest. The whole is more than the sum of its parts.
(11/n) If we know the range of observed proportions tends to exceed the range of the underlying truth, that the maximum is biased too high, the minimum biased too low, then it makes sense to estimate the underlying truth as closer together than the observed proportions.
(12/n) These are “shrinkage estimates” and you can get them in a number of ways. I personally like Bayesian hierarchical models. These models incorporate two levels of variability…one is the true variability across groups, the other is the random variability within each group.
(13/n) With estimates of across (real) and within (noise) group variability, you remove the within group variability in your estimates. The result pulls the observed proportions toward each other. This corrects for the biases above and results in better estimates for each group.
(14/n) Important note. I haven’t made use of external information. I don’t need substantive commonality. This is a property of the common random noise in the observed estimates, not that I’m running a basket trial. It’s a statement about the underlying variability.
(15/n) A key open question is how much to shrink. Within a Bayesian framework we place priors on the across and within group variability. These priors can/should incorporate knowledge of scientific commonality. We may apriori believe groups are closer together or farther apart.
(16/16) If there is interest, I’ll try to have some followup discussion applying this in different settings. For example on the limited severe disease data in the vaccine trials, or a possible alternative to the aducanumab futility analyses.

 Read on Twitter


