new, important results from #JPMCInstitute on the evolution of how much people have in their bank accounts this year
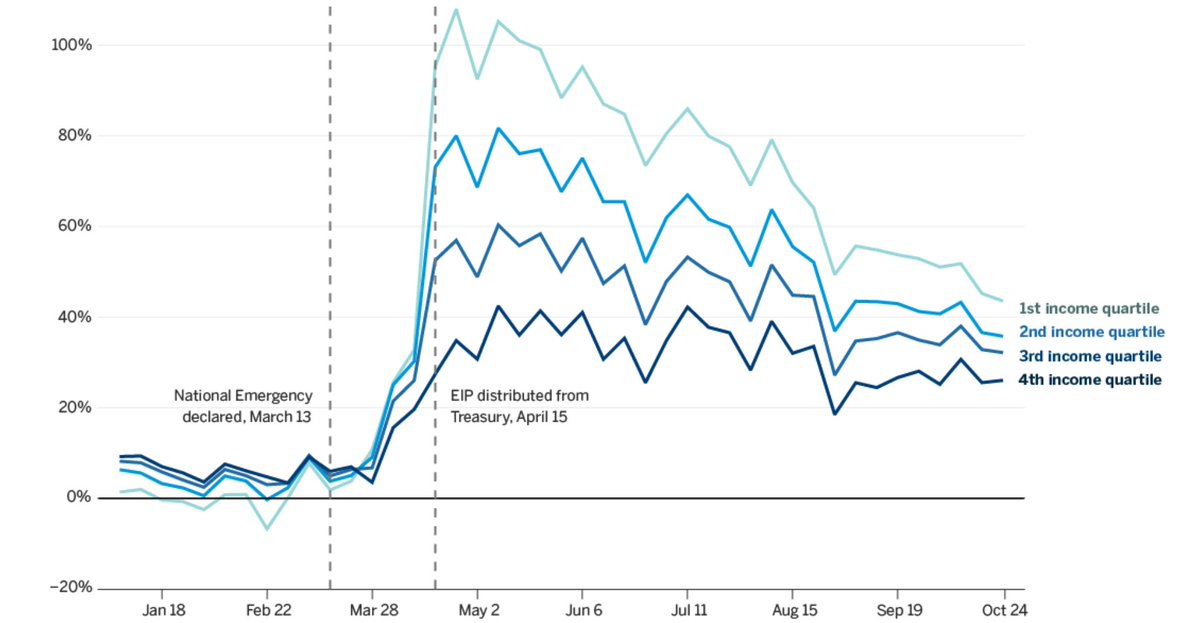
balances remain elevated, but are falling, especially at the bottom of the income and asset distribution

balances remain elevated, but are falling, especially at the bottom of the income and asset distribution

This is not research I did, but is by my fantastic coauthors https://www.jpmorganchase.com/institute/research/household-income-spending/household-cash-balances-during-covid-19-a-distributional-perspective/?jp_cmp=social_=fgtwitter_=liquidassetsinsight
@Farrell_Diana @FionaGreigDC
Erica Deadman @maxLiebeskind @Dan_M_Sullivan @chenzhao @pascaljnoel
@Farrell_Diana @FionaGreigDC
Erica Deadman @maxLiebeskind @Dan_M_Sullivan @chenzhao @pascaljnoel
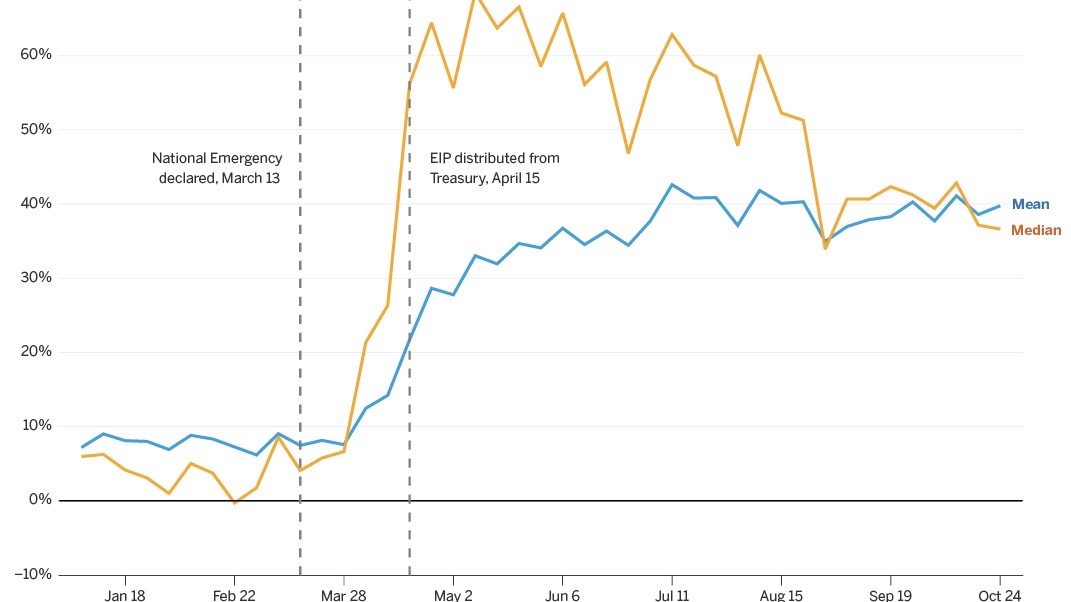
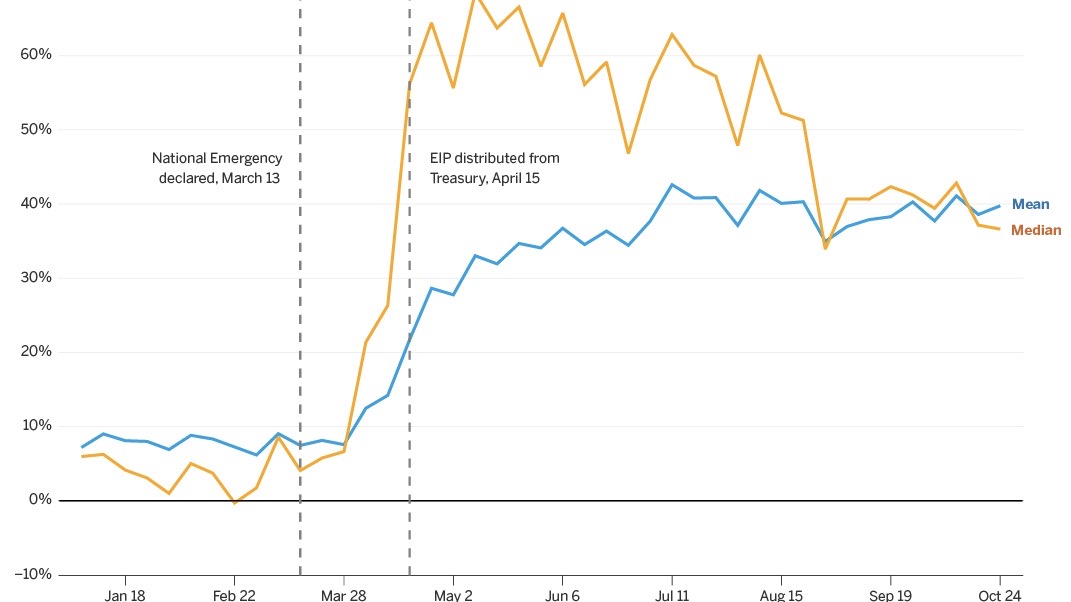
Let's unpack the first plot a little more:
1) balances rising even before EIPs go out, then jump sharply at EIP receipt
2) *mean* balances are basically constant since then, but *median* balances are falling
1) balances rising even before EIPs go out, then jump sharply at EIP receipt
2) *mean* balances are basically constant since then, but *median* balances are falling
what (2) implies is that more than half of people have falling balances, while some people have balances rising a lot. specifically, *low-income households* have falling balances
The JPMCI data are powerful because the median (or other aspects of the distribution) are not something we can learn about from other datasets.
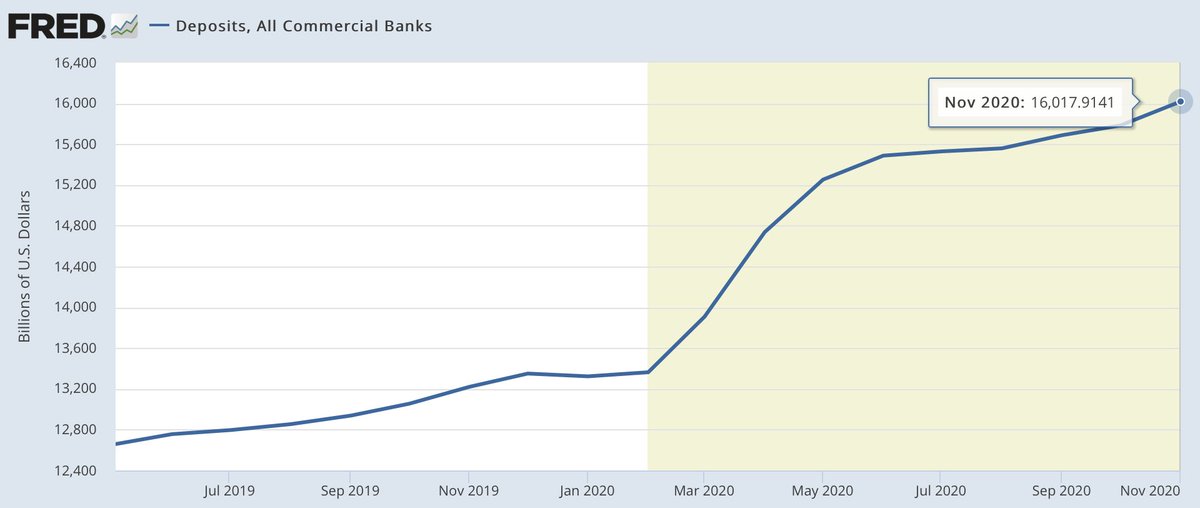
In the aggregate, bank deposits are up (just like the mean in JPMCI) https://fred.stlouisfed.org/series/DPSACBM027NBOG
why does this matter? @federalreserve and Congress want to know right now what are the likely effects of additional stimulus.
glass half full: median is up more than mean so less need for / impact of stimulus
glass half empty: median falling since August (data only thru Oct)
glass half full: median is up more than mean so less need for / impact of stimulus
glass half empty: median falling since August (data only thru Oct)
finally, I am curious to see more on the drivers of the change. the median changes most in August which is when PUC expires, so maybe do plot for UI and non-UI recipients? UI recipients not a big share of sample, but would be good to check nonetheless.

 Read on Twitter


