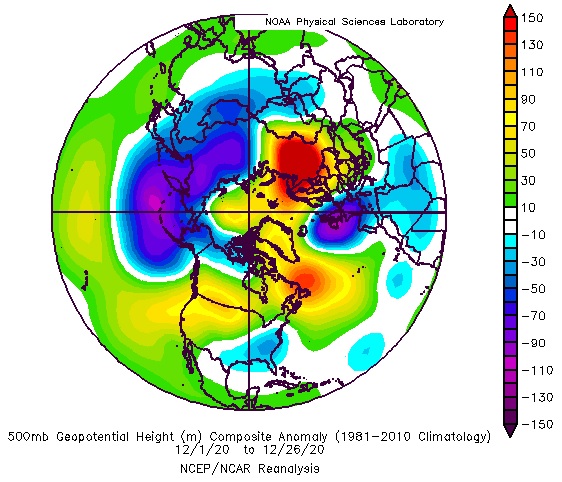
1/ This thread is about the 2020 winter and upcoming SSW through the analog perspective. First, we should see how we got here and compare with years since 1950. December NH 500mb view in Reanalysis so far has the obvious Aleutian Low and Urals/Barents High (known to disturb PV).
2/ I made two grids to focus on the Urals/Barents Ridge (50-80°N, 20-80°E) and the Aleutian Low (35-75°N, 150°E-150°W) for December and ran the anomalies for 1950-2020 (based on 1981-2010 climo in Reanalysis).
3/ Overall, there were 31/70 years with a stronger than normal Aleutian Low and 35/70 with stronger Urals/Barents High. Filtering by Niño 3.4 SST anomaly, we can see that overall ENSO doesn't necessarily dictate pattern here. However, Aleutian Low slightly more common in El Niño:
4/ Only 8 out of 70 years had a -0.5 or colder monthly 3.4 anomaly (La Niña) and an Aleutian Low between 1950-2019. They were: 1973, 1974, 1975, 1988, 1995, 2000, 2005 and 2011.
5/ Even more rare if you include the Barents High with the Aleutian Low during La Niña, you reduce the set to 1974, 2000, 2005 and 2011. The composite is okay but shifted east. Only 2005 had an official SSW in January of these 4.
6/ I care about the Barents/Urals High placement and existence because it has a stronger correlation, independently, to the January 10mb 60N u-wind than the Aleutian Low. Here's a chart with statistically significant correlation (gray bars mark official SSW events):
8/ Since 2000, the Aleutian Low and Barents/Urals High has been a good predictor for a January SSW (these charts only consider a technical SSW in January):
9/ Stepping away from ENSO and focusing only on Aleutian Low/Barents High Decembers...if we subtract the Jan No-SSW years from the Jan-SSW years at 500mb, we see that overall the Jan SSW years have even more ridging in Barents/Urals during December.
10/ Making the point further, the Aleutian Low Decembers in Reanalysis are broken down by if they went on to produce January SSWs. On the left are the years that did go on to produce SSW, and on the right are the years that didn't.
11/ 2020 is in rare company. The December combination of Aleutian Low/Barents High with La Niña conditions as stated before only happened 4 other times. Below is their December and January 500mb anomalies. Keep in mind only 2005 here had technical SSW in Jan.
12/ But! The December Aleutian Low winters that produced a January SSW had the following December and January 500mb anomalies. This is basically ignoring ENSO and focusing on the SSW instead:
13/ So what do we do? Assuming the 2020 SSW occurs in January (and we aren't too strict on ENSO), then there are only 3 years with Aleutian Low/Urals High in December that were non-El Niño (many were Niño). They are 1959-60, 2003-04 and 2005-06. December 500mb below:
14/ Here is what their 500mb anomalies looked like in Jan and Feb. Keep in mind that the dates for the SSW are as follows: 1/16-1/17 1960, 1/5-1/7/2004 and 1/21/2005. Their SSW impact happens at substantially different times.
15/ Since their central dates are different, I placed them inside 5-day periods in Reanalysis and created 500mb and surface temperature loops for NH. Below is the -5 to +30 day composite of 500mb anomalies that unfolded for these 3 events:
16/ Finally, here is the -5 to +35 day composite around the 3 SSW events of surface temperature anomalies. Southern Canada/CONUS in the composite do not significantly cool down until 20-30 days after SSW central date in these years.
17/ I know this is a lot of information, and I'm super tired currently. I hope it made some sense (feel free to ask questions). All composites for December 500mb heights/10mbwind etc. were done with Reanalysis. It was correlated well with JRA/MERRA-2/ERA5. Okay, time for a nap...

 Read on Twitter


