Many feel that this #Bitcoin  market cycle is accelerating faster than 2017. As things heat up it's instructive to look back at past cycles to see how on-chain metrics moved and get some context into our current trajectory.
 with comparison charts
 market cycle is accelerating faster than 2017. As things heat up it's instructive to look back at past cycles to see how on-chain metrics moved and get some context into our current trajectory.
 with comparison charts
1. Market Cap
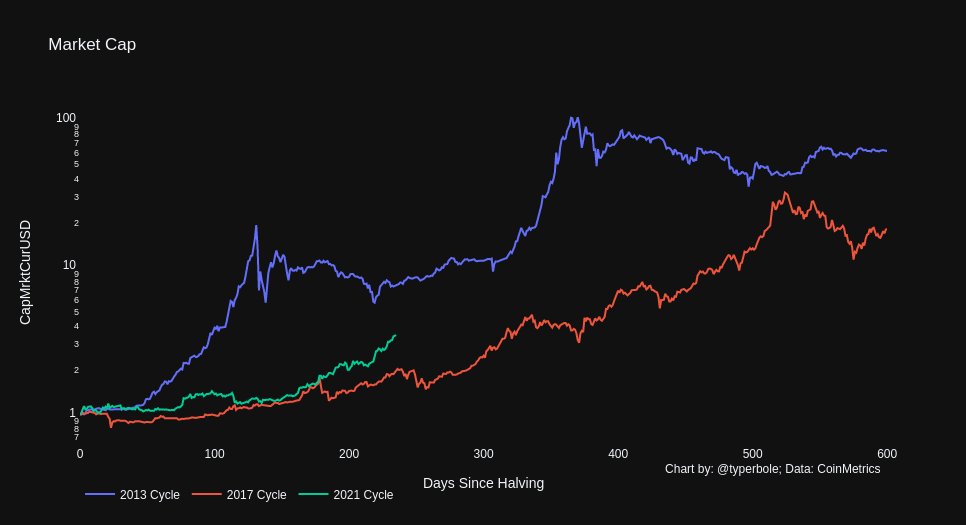
If we index Market Cap to the value at each cycle's halving, we can see that this current cycle (2021) hit an inflection point up ~150 days after the halving.
The inflection point for 2017 was closer to 250 days post-halving, and for 2013 it was 50 days.


If we index Market Cap to the value at each cycle's halving, we can see that this current cycle (2021) hit an inflection point up ~150 days after the halving.
The inflection point for 2017 was closer to 250 days post-halving, and for 2013 it was 50 days.


2. MVRV
When we look at MVRV the inflection points are even clearer. As always 2013 stands out with the violent double tops.
When we look at MVRV the inflection points are even clearer. As always 2013 stands out with the violent double tops.
3. Illiquid supply
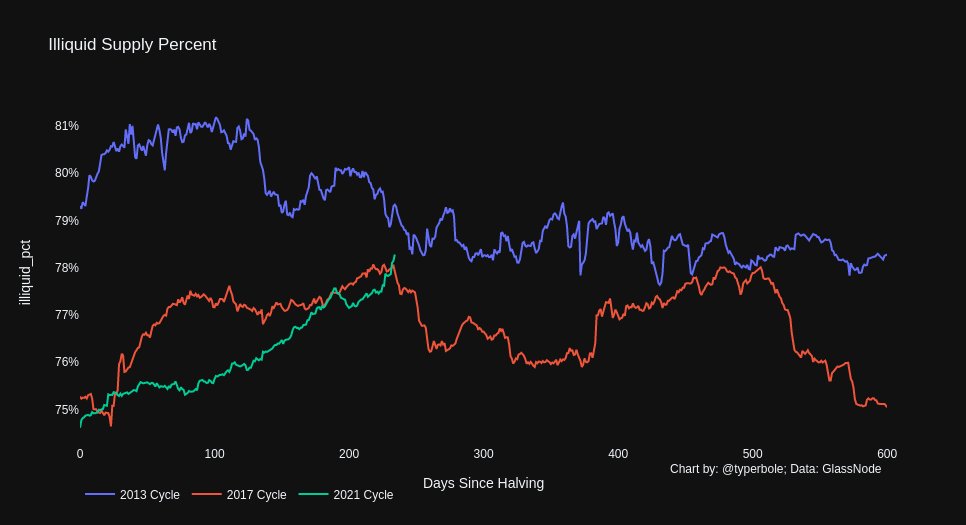
@glassnode recently did some excellent work to classify UTXOs as "liquid" or "illiquid".
If we look at the percent of total supply classified as illiquid we see an interesting pattern this cycle: illiquid supply is rocketing up at an increasing rate.
@glassnode recently did some excellent work to classify UTXOs as "liquid" or "illiquid".
If we look at the percent of total supply classified as illiquid we see an interesting pattern this cycle: illiquid supply is rocketing up at an increasing rate.
Previous cycles reached peak illiquidity earlier, then gradually declined as coins moved back from cold storage to be sold. We haven't reached peak illiquidity yet and the upward trajectory shows no signs of abating.
The great Sat Scoop of 2020 accelerates into 2021.
The great Sat Scoop of 2020 accelerates into 2021.
4. On-Chain Transaction Volume ($USD)
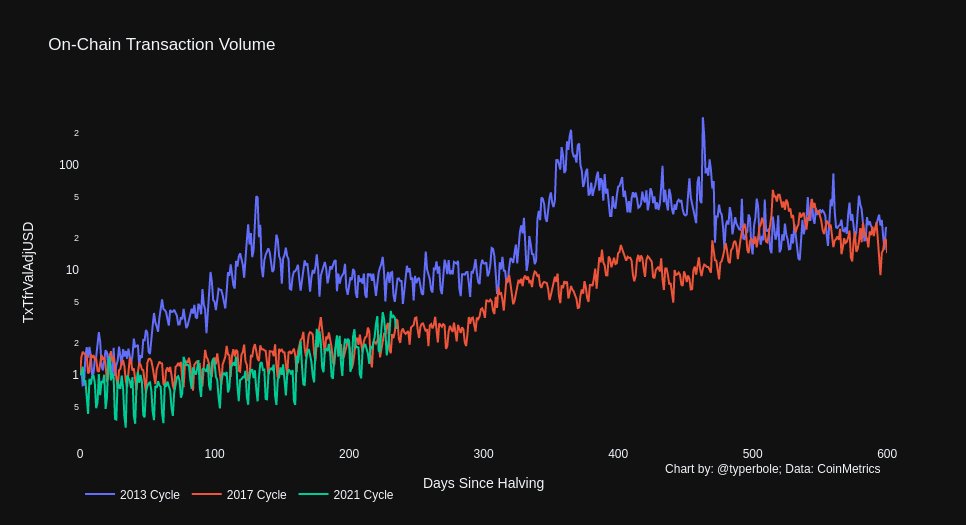
Growth in on-chain transaction volume post-halving is right in line with the 2017 cycle.
So even though market cap growth is outpacing this cycle, on-chain volume is on a similar trajectory to 2017.
Growth in on-chain transaction volume post-halving is right in line with the 2017 cycle.
So even though market cap growth is outpacing this cycle, on-chain volume is on a similar trajectory to 2017.
5. Active On Chain Addresses
Growth in active on chain addresses is slower this cycle than in 2013 and 2017. This is consistent with the hypothesis that retail has not arrived en masse yet, and this rally is being driven by a smaller set of early adopting institutions and HNWI.
Growth in active on chain addresses is slower this cycle than in 2013 and 2017. This is consistent with the hypothesis that retail has not arrived en masse yet, and this rally is being driven by a smaller set of early adopting institutions and HNWI.
6. Recently Created Realized Cap
I've been tracking the percent of realized cap value created in the past three months as an indicator. Blowoff tops occur at 80%+ when the influx of new money into BTC becomes unsustainable.
https://twitter.com/typerbole/status/1339632890519429120
I've been tracking the percent of realized cap value created in the past three months as an indicator. Blowoff tops occur at 80%+ when the influx of new money into BTC becomes unsustainable.
https://twitter.com/typerbole/status/1339632890519429120
This cycle started at a lower point than in 2017 but has shot up to >50% in the past month, outpacing 2017.
More money is coming in sooner than observed in 2017.
More money is coming in sooner than observed in 2017.
7. Volatility
So far this cycle is about as volatile as 2017 when measured using @coinmetrics 30 day trailing vol.
I was surprised by this as so far we haven't really experienced much volatility to the downside. Perhaps we've had more volatility to the upside to compensate.
So far this cycle is about as volatile as 2017 when measured using @coinmetrics 30 day trailing vol.
I was surprised by this as so far we haven't really experienced much volatility to the downside. Perhaps we've had more volatility to the upside to compensate.
This cycle so far compared to 2017:
- Market Cap is growing faster
- Sell side liquidity is drying up faster and more aggressively
- Active addresses are growing slower, less retail participation in rally
- Volatility the same, but coming more from upside
- Market Cap is growing faster
- Sell side liquidity is drying up faster and more aggressively
- Active addresses are growing slower, less retail participation in rally
- Volatility the same, but coming more from upside

 Read on Twitter


