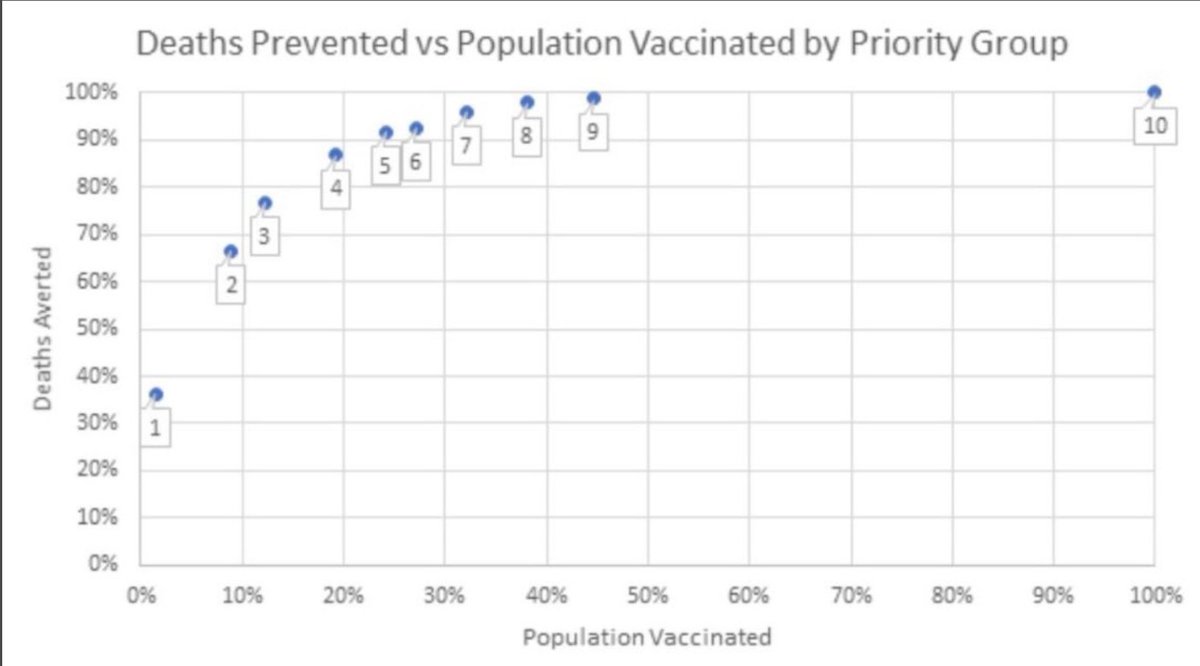
I've tried to add to @COVID19actuary @ActuaryByDay excellent graph from http://www.covid-arg.com & look at how vaccination impacts hospital & ICU admission
Several assumptions
- assumed vaccination 100% protective (its best protection is against disease progression)
1/6
Several assumptions
- assumed vaccination 100% protective (its best protection is against disease progression)
1/6
Here I've plotted age gps vaccinated & impact on hospital, ICU admissions & deaths
Used @ICNARC June data (end first surge) for ICU admissions & @ISARIC1 BMJ data for hospital admission
ICU admissions hardest to crack as are youngest cohort
-assumes 100% vaccine efficacy
2/6
Used @ICNARC June data (end first surge) for ICU admissions & @ISARIC1 BMJ data for hospital admission
ICU admissions hardest to crack as are youngest cohort
-assumes 100% vaccine efficacy
2/6
Here % popln vaccinated & impact on hospital, ICU admissions & deaths
Used @ICNARC June data (end first surge) for ICU admissions & @ISARIC1 BMJ data for hospital admission
-assumes 100% vaccine efficacy
3/6
Used @ICNARC June data (end first surge) for ICU admissions & @ISARIC1 BMJ data for hospital admission
-assumes 100% vaccine efficacy
3/6
I've
assumed
-100% vaccine efficacy
-all care home deaths are in >80s
& reduced population of 40-60yr olds by 4.4 million to account for extremely clinically vulnerable & health/social care workers who are in the higher vaccination groups (Gp 2 & 4)
Happy to be corrected!
4/6
assumed
-100% vaccine efficacy
-all care home deaths are in >80s
& reduced population of 40-60yr olds by 4.4 million to account for extremely clinically vulnerable & health/social care workers who are in the higher vaccination groups (Gp 2 & 4)
Happy to be corrected!
4/6
Worth noting the ICU admission curve deviates most from mortality curve
2 main reasons
no 1
most deaths don't occur in ICU (6 of 7 hospital deaths occur outside ICU in surge 1) …https://associationofanaesthetists-publications.onlinelibrary.wiley.com/doi/10.1111/anae.15220
5/6
2 main reasons
no 1
most deaths don't occur in ICU (6 of 7 hospital deaths occur outside ICU in surge 1) …https://associationofanaesthetists-publications.onlinelibrary.wiley.com/doi/10.1111/anae.15220
5/6

 Read on Twitter


