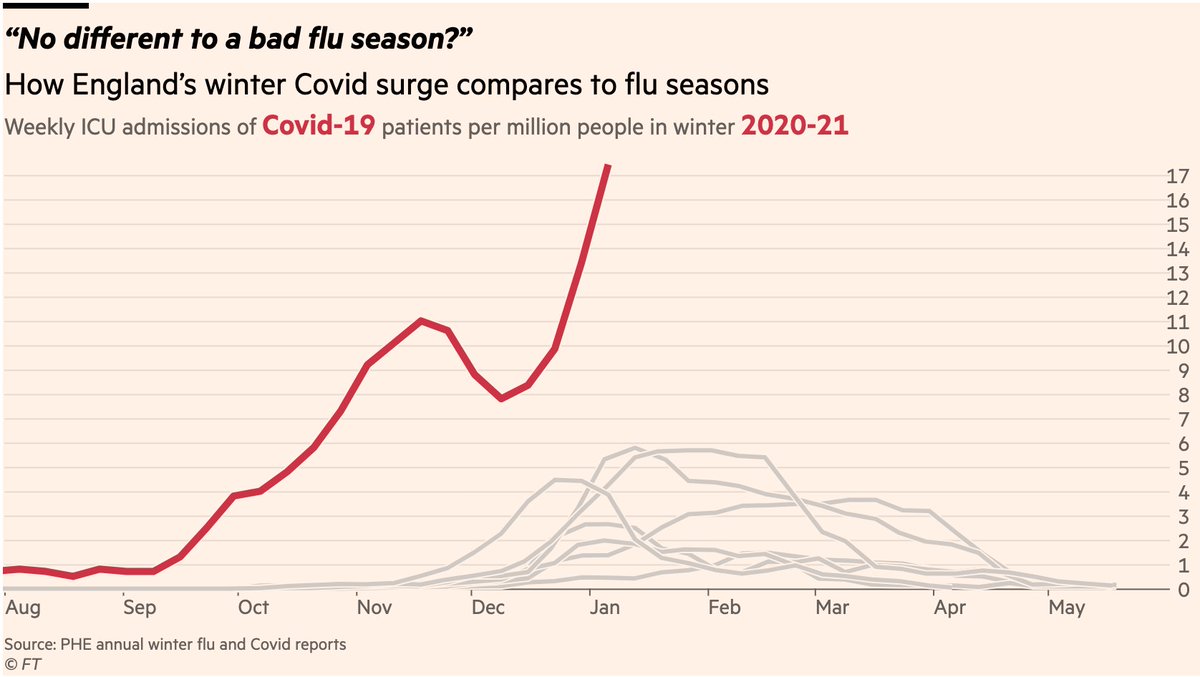
NEW: a common response to reports of hospitals struggling this winter is "it’s no different to a bad flu season!"
I’ve tracked down historical data on flu ICU admissions, including winter 2017-18, a record high.
Here’s how England’s Covid winter compares to a bad flu season
I’ve tracked down historical data on flu ICU admissions, including winter 2017-18, a record high.
Here’s how England’s Covid winter compares to a bad flu season

We can also address claims like "hospitals are always full in winter", or "it’s just people who were already in hospital for other reasons catching Covid on the ward"
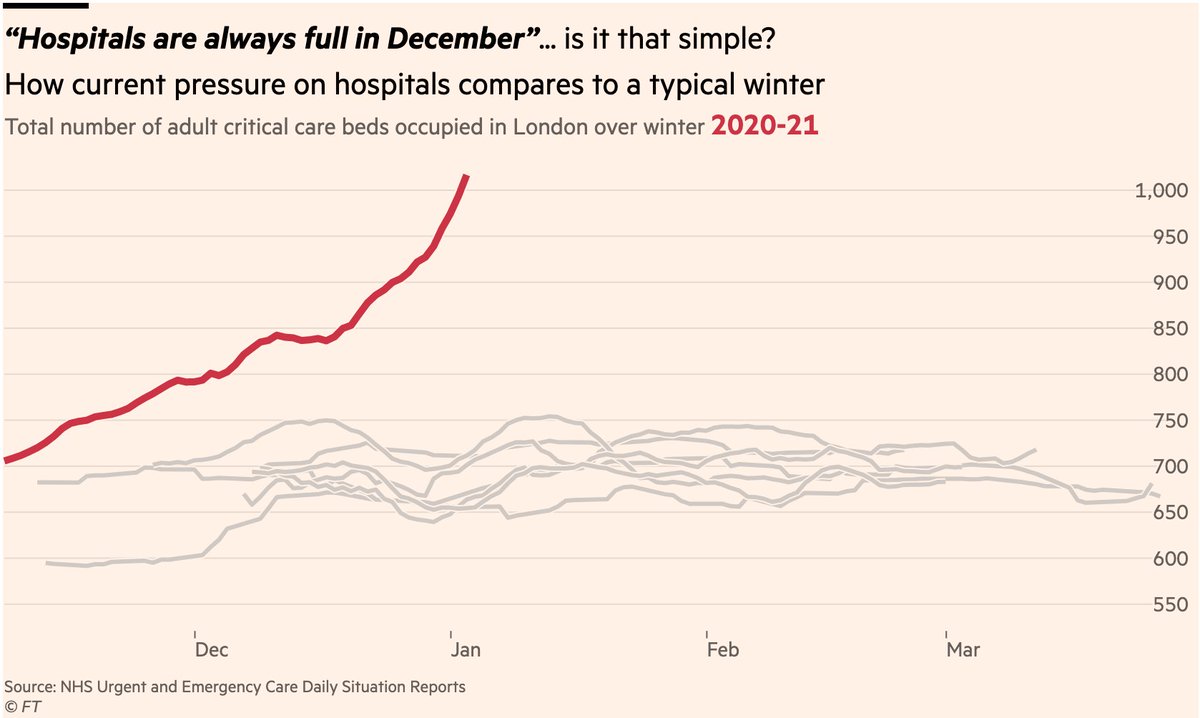
Here are numbers of people in ICU beds (for any reason) in London hospitals, each winter
Spot the odd one out
Here are numbers of people in ICU beds (for any reason) in London hospitals, each winter
Spot the odd one out
Unless there has been a coincidental 50% rise in ICU admissions for other reasons (narrator: there hasn’t https://twitter.com/john_actuary/status/1345072641309335552), the only explanation for an unprecedented surge in ICU occupancy this winter is people who are there *because they caught Covid*.
And similarly, it cannot be true that people ill with Covid "are just the same people who would usually be admitted with flu", when the numbers of people admitted to ICU with Covid are several times larger then even a historically bad flu season.
This is why hospitals in London (and beyond) face a genuine risk of being totally overwhelmed in the coming weeks https://twitter.com/HSJEditor/status/1346933766082580480
Doctors & nurses do amazing, stressful work reallocating beds to squeeze Covid patients into, but a) those beds are taken away from other patients who risk losing treatment for other illness & injury, and b) when numbers get high enough, there simply aren’t any more beds or staff
Unfortunately that’s where we now are in parts of the country, and the consequences will be grim.
Sources:
• Chart 1 uses Covid data from the brilliant @PHE_uk weekly surveillance report, and compares it to data I extracted from past annual flu reports https://www.gov.uk/government/statistics/annual-flu-reports
• Chart 2 uses @NHSEngland daily situation reports on critical care beds https://www.england.nhs.uk/statistics/statistical-work-areas/uec-sitrep/

 Read on Twitter


