So of course this  sent me down a rabbit hole, because... Pennsylvania! County stats!
Anyone want to guess which two PA counties saw largest net *losses* to Dems due to voters switching parties since January 1, 2021? https://twitter.com/ElectProject/status/1352114807994986496
 sent me down a rabbit hole, because... Pennsylvania! County stats!
 Anyone want to guess which two PA counties saw largest net *losses* to Dems due to voters switching parties since January 1, 2021? https://twitter.com/ElectProject/status/1352114807994986496
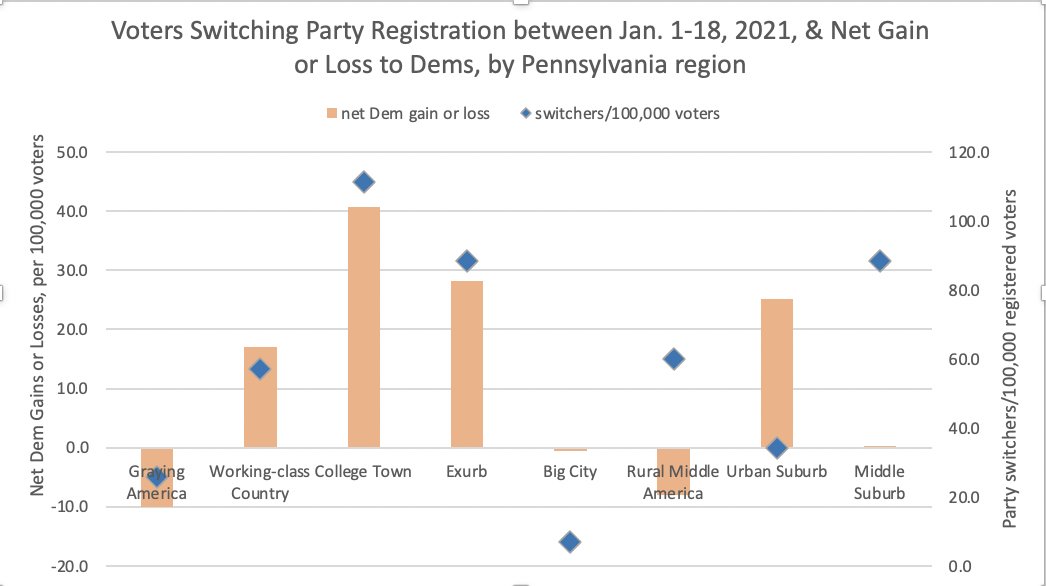
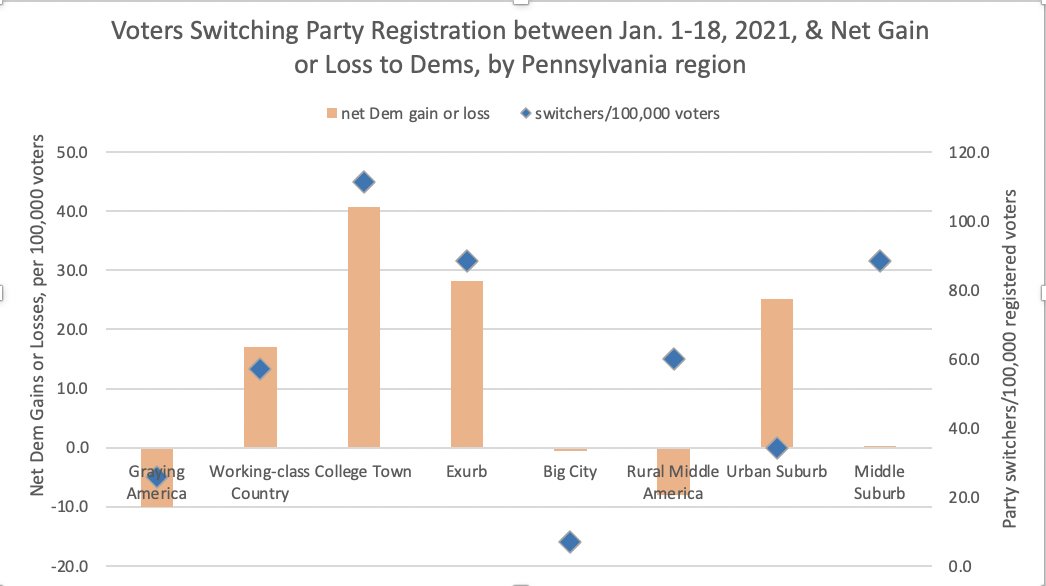
The breakdown of January-madness PA party registration switchers by @AmCommPro county category? Yes of course I have that for you; what else would I be doing at 1 am
To clarify: these aren't overall net changes in reg: they're net changes only among people who proactively contacted their county Board of Elex btwn Jan 1 & Jan 18 to change party registration: something that almost never happens in January. So, basically, ~100% fallout of 1/6/21
... and while you might look at this and say, man, really nothing political happening in those [former rust belt, blue-collar/pink-collar] Middle Suburb counties...
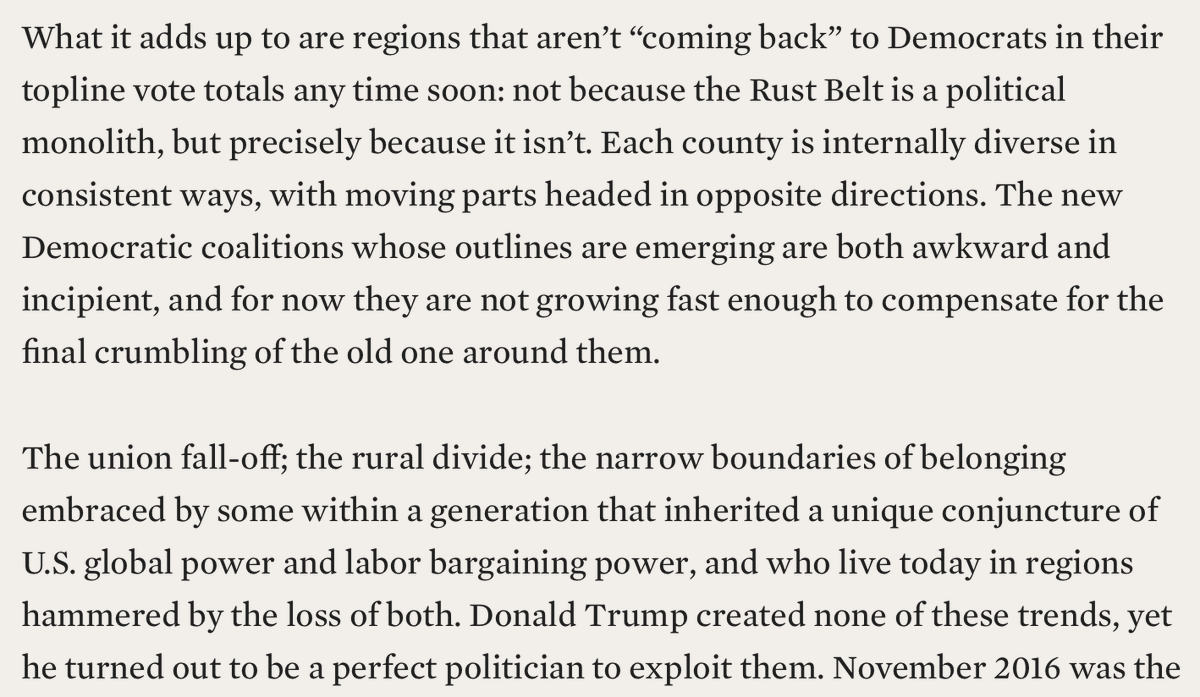
...you'd be exactly wrong, because there is *tons* of political change happening in rust belt/Middle Suburb counties: it's just happening in opposite directions all at once, with opposing sub-county-level trends cancelling each other out in the top-line totals


I wrote this about lived political change in Pennsylvania's former industrial, blue-collar/pink-collar "Middle Suburb" counties for @DemJournal a year ago, & yeah, it holds up. Because, yeah, they're complicated. https://democracyjournal.org/magazine/57/rust-belt-in-transition/
 about lived political change in Pennsylvania's former industrial, blue-collar/pink-collar "Middle Suburb" counties for @DemJournal a year ago, & yeah, it holds up. Because, yeah, they're complicated. https://democracyjournal.org/magazine/57/rust-belt-in-transition/
Ok one more chart, underlining how the partisan realignment of this moment is not uniform across space. PA's College Town & Exurb counties seeng lots of movement in last 2 wks, netting out to favor Dems. Urban Suburbs seeing way fewer switchers, but uniformly all in Dem direction
And Middle Suburbs with the near-highest rate of vote switchers per capita: but none of that turmoil visible in the aggregate totals, as here the numbers of former Dems renouncing the Democratic label are exactly balanced by the numbers of former Republicans embracing it
Still accepting guesses as to which counties saw the largest net loss to Dems & GOP respectively. @ClareHDooley correctly guessed Westmoreland, though once you adjust by size of county voting pop Westmoreland falls to second place in net-switchers-to-GOP this month. More guesses?
 Would have thought so too! But Fayette saw as many D-to-R switches this month as R-to-D. Suggests high-info/trust voters in Fayette, engaged enough to switch rather than just swear off in disgust, are not typical of Fayette D-to-Trump voters more broadly? https://twitter.com/mikewasson/status/1352603224969252866
 but no! People, Beaver Dems gained *30* party switchers this month and Beaver GOP gained only 24 @BCVoice4Change

 https://twitter.com/dfkpgh/status/1352604961675354113
 Nope Philly GOP gained 43 but Dems gained 36: among lowest overall rate of switchers-as-%-of-voting-pop in state. (Meanwhile Allegheny reports zero January switches, in this latest PA data, but that must be a reporting gap? @4st8?) https://twitter.com/beardedcrank/status/1352604005860581382
[people gaze & appreciate True Art 
 ]
]
Actually Washington County PA *gained* 21 net party switchers this month! @co_wash grassroots ftw! https://twitter.com/BobGradeck/status/1352610519501385728

 ]
]Actually Washington County PA *gained* 21 net party switchers this month! @co_wash grassroots ftw! https://twitter.com/BobGradeck/status/1352610519501385728
 Nails it. In relation to total size of voting pop, Lancaster, Delco, & Cumberland saw largest net Dem gains from party switchers this month. With Chester, Montco, Wayne & Dauphin not that far behind... https://twitter.com/akefer/status/1352612136099446785
 And now we have the winner on the opposite side of the aisle as well. Yes, population-adjusted Cambria county saw by far the largest surge of net-party-switchers-to-GOP in the state this month: nearly twice as high as Westmoreland, the next runner up https://twitter.com/CliftonPA/status/1352611573500702722
Ok I'm an idiot, bc until @BCVoice4Change mentioned it I had not seen that actually *all* the important action in PA voters changing registration in response to recent events is in the moves to Other. PA GOP saw **7,356** voters change away fr the GOP since Jan 1, 2/3 to Other
Actually even that underestimates the phenomenon, since not all counties' data is complete. Elsewhere in same report we see over 12,000 voters have changed registration since Jan 1 *via online system alone*, with great majority ending up as Other (inc eg 830 voters in Allegheny)

 Read on Twitter
![... and while you might look at this and say, man, really nothing political happening in those [former rust belt, blue-collar/pink-collar] Middle Suburb counties... ... and while you might look at this and say, man, really nothing political happening in those [former rust belt, blue-collar/pink-collar] Middle Suburb counties...](https://pbs.twimg.com/media/EsPEXT3XEAQbmnL.jpg)


