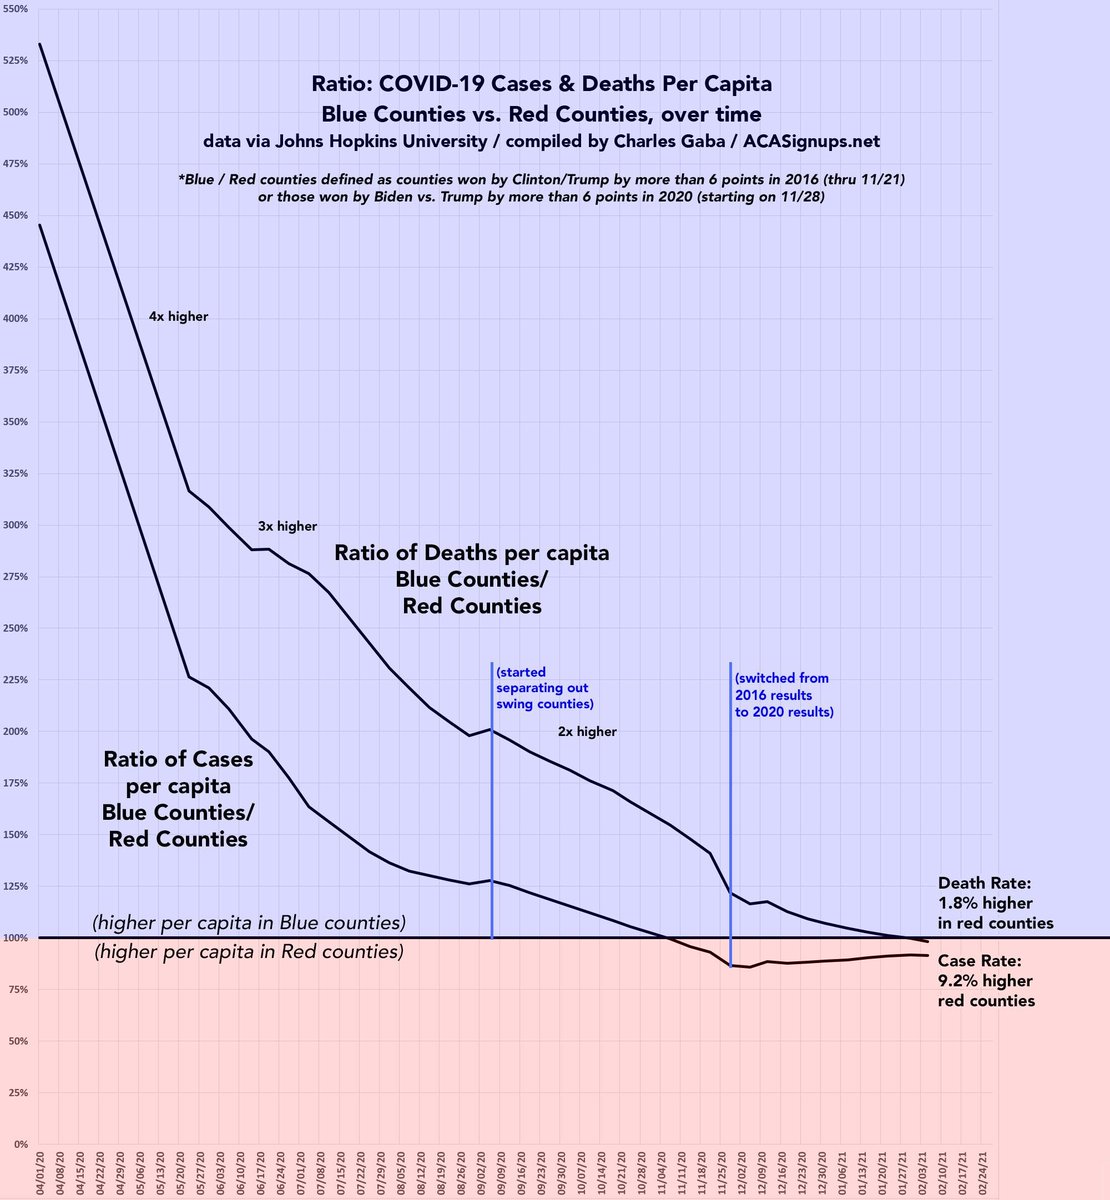
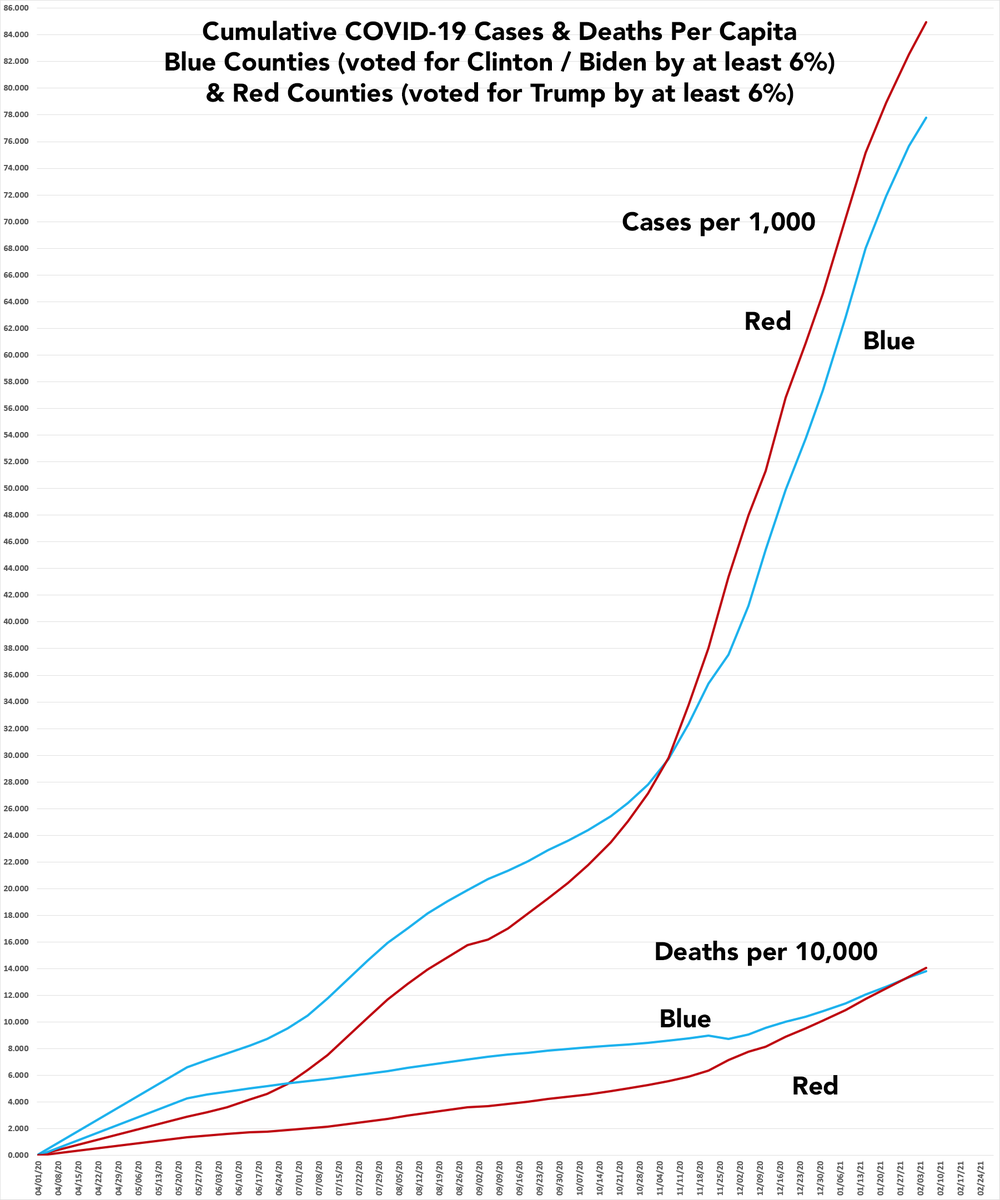
 It's Official: Cumulative #COVID19 cases *AND* deaths per capita are now higher in Red Counties than in Blue Counties nationally: 1/ https://acasignups.net/21/02/06/weekly-update-which-counties-have-highest-capita-rates-covid19-cases-and-deaths
Counties w/highest cumul. #COVID19 cases per capita:
1. Crowley County, CO
2. Chattahoochee County, GA
3. Bent County, CO
4. Lincoln County, AR
5. Dewey County, SD
6. Lake County, TN
7. Norton County, KS
8. Bon Homme County, SD
9. Buffalo County, SD
10. Trousdale County, TN
2/
1. Crowley County, CO
2. Chattahoochee County, GA
3. Bent County, CO
4. Lincoln County, AR
5. Dewey County, SD
6. Lake County, TN
7. Norton County, KS
8. Bon Homme County, SD
9. Buffalo County, SD
10. Trousdale County, TN
2/
Fully 31% of Crowley County, CO has now tested positive for #COVID19 over the past year (1,884 out of 6,061 residents.
There's 11 counties where at least 20% of the population has tested positive, and 57 counties where at least 15% has. 3/
There's 11 counties where at least 20% of the population has tested positive, and 57 counties where at least 15% has. 3/
Counties w/highest cumul. #COVID19 *deaths* per capita:
1. Jerauld County, SD
2. Gove County, KS
3. Buffalo County, SD
4. Dickey County, ND
5. Iron County, WI
6. Galax, VA
7. Gregory County, SD
8. Grant County, NE
9. Hancock County, GA
10. Emporia, VA
4/
1. Jerauld County, SD
2. Gove County, KS
3. Buffalo County, SD
4. Dickey County, ND
5. Iron County, WI
6. Galax, VA
7. Gregory County, SD
8. Grant County, NE
9. Hancock County, GA
10. Emporia, VA
4/
1 out of every 125 residents of Jerauld County, SD has died (16 out of 2,013).
There's 33 counties where at least 1 out of every 200 residents has died, and 488 counties where at least 1 out of every 400 have died of it.
5/
There's 33 counties where at least 1 out of every 200 residents has died, and 488 counties where at least 1 out of every 400 have died of it.
5/
--There's now just 60 counties (out of over 3,200 nationally) which haven't reported any #COVID19 deaths. Total population? 255,000 people.
--There's now just 3 counties which haven't reported any COVID-19 cases. Total population? 3,070.
6/
--There's now just 3 counties which haven't reported any COVID-19 cases. Total population? 3,070.
6/
Here's what I'm talking about at the beginning of this thread. This graph shows the *ratio* of cases & deaths per capita between red & blue counties.
Cumulative case rates are now 9.2% higher & cumulative *death* rates are now 1.8% higher per capita in the red counties. 7/
Cumulative case rates are now 9.2% higher & cumulative *death* rates are now 1.8% higher per capita in the red counties. 7/

 Read on Twitter


